sar is a short term abbreviation for System Activity Report.
Important points for sar
- It can be used for realtime monitoring of Linux system performance.
- The sar command writes to standard output based on the values in the count and interval parameters
- The collected data can also be saved in the file specified by the -o filename flag, in addition to being displayed onto the screen.
- You can select information about specific system activities using flags. Not specifying any flags selects only CPU activity.
- The sar command extracts and writes to standard output records previously saved in a file. This file can be either the one specified by the -f flag.
- All data is captured in binary form and saved to a file (datafile) with default location /var/log/sa/saXX where XX specified the day of the month
Package required (Sysstat)
Before you start running the sar command make sure that the required package for the same is installed in your machine i.e.sysstat package
For Red Hat Linux
Check if the rpm exists already
# rpm -qa | grep sysstat
If it is not installed you can install the same using
# yum install sysstat
If we try to query the installed packages for sysstat
[deepak@test1 ~]$ rpm -ql sysstat
/etc/cron.d/sysstat
/usr/bin/iostat
/usr/bin/mpstat
/usr/bin/sadf
/usr/bin/sar
/usr/lib64/sa
/usr/lib64/sa/sa1
/usr/lib64/sa/sa2
/usr/lib64/sa/sadc
|
Package
|
Usage
|
|
sysstat
|
To define the maximum no. of days to save sar reports
|
|
iostat
|
Report Central Processing Unit (CPU) statistics and input/output statistics
|
|
mpstat
|
Report processors related statistics
|
|
sadf
|
Display data collected by sar in multiple formats
|
|
sar
|
Collect, report, or save system activity information
|
|
sa
|
summarizes accounting information
|
|
sa1
|
Collect and store binary data in the system activity daily data file
|
|
Sa2
|
Write a daily report in the /var/log/sa directory
|
|
sadc
|
System activity data collector
|
So as you see now sar has been installed
To check the version
[deepak@test1 ~]$ sar -V
sysstat version 7.0.2
(C) Sebastien Godard
Collect sar reports on a daily basis using cron jobs (This entry is made by default as soon as you install sysstat package)
[root@test1 ~]# cat /etc/cron.d/sysstat
# run system activity accounting tool every 10 minutes
*/10 * * * * root /usr/lib64/sa/sa1 1 1
# generate a daily summary of process accounting at 23:53
53 23 * * * root /usr/lib64/sa/sa2 -A
Syntax:
# sar {argument} {interval} {count}
CPU usage reports
Even if you don't use any argument along with sar command it will show you the overall CPU utilization. But the best part about sar is that you can use it to view realtime activity for any performance related feature in Linux using the count and interval parameter along with sar command
For example:
[deepak@test1 ~]$ sar
Linux 2.6.18-348.el5 (test1) 02/20/14
00:00:01 CPU %user %nice %system %iowait %steal %idle
00:10:01 all 18.03 0.00 9.38 2.24 0.00 70.35
00:20:02 all 17.04 0.00 6.90 2.70 0.00 73.37
00:30:01 all 11.90 0.00 4.33 1.76 0.00 82.01
00:40:01 all 8.67 0.00 2.60 0.21 0.00 88.51
00:50:01 all 7.99 0.00 2.35 0.62 0.00 89.04
01:00:01 all 8.78 0.00 2.54 0.29 0.00 88.38
01:10:01 all 9.44 0.00 4.71 0.65 0.00 85.19
01:20:01 all 14.26 0.00 4.69 0.50 0.00 80.55
01:30:01 all 7.94 0.00 4.52 0.36 0.00 87.18
01:40:01 all 27.02 0.00 6.04 0.30 0.00 66.64
Average: all 17.90 0.00 10.60 1.54 0.00 69.96
Explanation: CPU utilization reports using (-u) argument. Since no interval and count argument is specified, it will show the report activity for complete day.
For example:
[deepak@test1 ~]$ sar -u 2 5
Linux 2.6.18-348.el5 (test1) 02/20/14
05:24:03 CPU %user %nice %system %iowait %steal %idle
05:24:05 all 20.05 0.00 4.24 3.50 0.00 72.21
05:24:07 all 19.88 0.00 5.72 3.12 0.00 71.28
05:24:09 all 11.22 0.00 7.72 1.94 0.00 79.12
05:24:11 all 21.12 0.00 4.45 3.37 0.00 71.05
05:24:13 all 20.45 0.00 4.44 3.61 0.00 71.49
Average: all 18.54 0.00 5.32 3.11 0.00 73.03 Explanation: In the above command we have specified an interval argument of 2 and count argument of 5 so it will give us a realtime report of cpu utilization for every 2 seconds for a total of 5 output along with average of all.
|
Value
|
Meaning
|
|
%user
|
Percentage of CPU utilization that occurred while executing at the user level (application).
|
|
%nice
|
Percentage of CPU utilization that occurred while executing at the user level with nice priority.
|
|
%system
|
Percentage of CPU utilization that occurred while executing at the system level (kernel).
|
|
%iowait
|
Percentage of time that the CPU or CPUs were idle during which the system had an outstanding disk I/O request.
|
|
%steal
|
Show the percentage of time spent in involuntary wait by the virtual CPU or CPUs while the hypervisor was servicing another virtual processor.
|
|
%idle
|
Percentage of time that the CPU or CPUs were idle and the system did not have an outstanding disk I/O request.
|
Individual CPU reports
[deepak@test1 ~]$ sar -P ALL | less
2Linux 2.6.18-348.el5 (test1) 02/20/14
00:00:01 CPU %user %nice %system %iowait %steal %idle
00:10:01 all 18.03 0.00 9.38 2.24 0.00 70.35
00:10:01 0 7.37 0.00 11.23 0.94 0.00 80.46
00:10:01 1 8.29 0.00 6.42 0.87 0.00 84.41
00:10:01 2 6.17 0.00 8.05 1.24 0.00 84.53
00:10:01 3 8.40 0.00 6.62 1.31 0.00 83.68
00:10:01 4 7.51 0.00 6.40 0.56 0.00 85.53
Average: CPU %user %nice %system %iowait %steal %idle
Average: all 17.90 0.00 10.60 1.54 0.00 69.96
Average: 0 9.69 0.00 8.76 0.39 0.00 81.16
Average: 1 11.33 0.00 7.51 0.57 0.00 80.59
Average: 2 11.28 0.00 7.30 0.54 0.00 80.88
Average: 3 10.96 0.00 7.14 0.68 0.00 81.22
Average: 4 10.66 0.00 7.30 0.45 0.00 81.58 Explanation: Report CPU utilization for all the processors (If no interval and count value is specified it will show the statistics of complete day from the time monitoring started)
[deepak@test1 ~]$ sar -P 1 2 4
Linux 2.6.18-348.el5 (test1) 02/20/14
05:31:27 CPU %user %nice %system %iowait %steal %idle
05:31:29 1 0.00 0.00 0.00 0.00 0.00 100.00
05:31:31 1 0.00 0.00 0.00 0.00 0.00 100.00
05:31:33 1 0.00 0.00 0.50 0.00 0.00 99.50
05:31:35 1 1.49 0.00 0.00 0.00 0.00 98.51
Average: 1 0.37 0.00 0.12 0.00 0.00 99.50 Explanation: Report CPU utilization of CPU 1 for an interval of 2 seconds (count = 4) along with an average value
Memory and swap space usage Reports
Explanation: The above command will show 4 consecutive outputs for memory and swap space utilization statistics at an interval of 2 seconds.
|
Values
|
Meaning
|
|
kbmemfree
|
Amount of free memory available in kilobytes
|
|
kbmemused
|
Amount of used memory in kilobytes
|
|
%memused
|
Percentage of used memory
|
|
kbbuffers
|
Amount of memory used as buffers by the kernel in kilobytes
|
|
kbcached
|
Amount of memory used to cache data by the kernel in kilobytes
|
|
kbswpfree
|
Amount of free swap space in kilobytes
|
|
kbswpused
|
Amount of used swap space in kilobytes
|
|
%swpused
|
Percentage of used swap space
|
|
kbswpcad
|
Amount of cached swap memory in kilobytes.
|
Network Utilization Statistics
[deepak@test1 ~]$ sar -n DEV 1 1
Linux 2.6.18-348.el5 (test1) 02/20/14
06:07:37 IFACE rxpck/s txpck/s rxbyt/s txbyt/s rxcmp/s txcmp/s rxmcst/s
06:07:38 lo 125.00 125.00 288.00 288.00 0.00 0.00 0.00
06:07:38 eth0 671.00 794.00 387.00 437.00 0.00 0.00 1.00
06:07:38 eth1 0.00 0.00 0.00 0.00 0.00 0.00 1.00
06:07:38 eth2 0.00 0.00 0.00 0.00 0.00 0.00 0.00
06:07:38 eth3 384.00 651.00 413.00 730.00 0.00 0.00 0.00
6:07:38 bond0 671.00 794.00 387.00 437.00 0.00 0.00 2.00
06:07:38 bond1 70.00 74.00 213.00 593.00 0.00 0.00 2.00
Average: IFACE rxpck/s txpck/s rxbyt/s txbyt/s rxcmp/s txcmp/s rxmcst/s
Average: lo 125.00 125.00 288.00 288.00 0.00 0.00 0.00
Average: eth0 671.00 794.00 387.00 437.00 0.00 0.00 1.00
Average: eth1 0.00 0.00 0.00 0.00 0.00 0.00 1.00
Average: eth2 0.00 0.00 0.00 0.00 0.00 0.00 0.00
Average: eth3 384.00 4651.00 413.00 730.00 0.00 0.00 0.00
Average: bond0 671.00 794.00 387.00 437.00 0.00 0.00 2.00
Average: bond1 70.00 74.00 213.00 593.00 0.00 0.00 2.00
Explanation: Report network statistics. With the DEV keyword, statistics from the network devices are reported.
|
Value
|
Meaning
|
|
IFACE
|
Name of the network interface for which statistics are reported
|
|
rxpck/s
|
Total number of packets received per second
|
|
txpck/s
|
Total number of packets transmitted per second
|
|
rxbyt/s
|
Total number of bytes received per second
|
|
txbyt/s
|
Total number of bytes transmitted per second
|
|
rxcmp/s
|
Number of compressed packets received per second (for cslip etc.)
|
|
txcmp/s
|
Number of compressed packets transmitted per second
|
|
rxmcst/s
|
Number of multicast packets received per second
|
No. of Process created per second Reports
[deepak@test1 ~]$ sar -c 1 3
Linux 2.6.18-348.el5 (test1) 02/20/14
06:10:29 proc/s
06:10:30 1152.00
06:10:31 1059.00
06:10:32 1082.18
Average: 1097.67 Explanation: Report process creation activity using -c argument. The above command shows 3 consecuitve output for every second.
Load Average Reports
[deepak@test1 ~]$ sar -q 2 4
Linux 2.6.18-348.el5 (test1) 02/20/14
06:20:19 runq-sz plist-sz ldavg-1 ldavg-5 ldavg-15
06:20:21 7 2464 8.40 9.63 10.46
06:20:23 13 2467 8.21 9.57 10.44
06:20:25 7 2465 8.21 9.57 10.44
06:20:27 7 2460 8.21 9.57 10.44
Average: 8 2464 8.26 9.59 10.45 Explanation: Report queue length and load averages with 4 output at an interval of 2 seconds for each output.
|
Value
|
Meaning
|
|
runq-sz
|
Run queue length (number of processes waiting for run time)
|
|
plist-sz
|
Number of processes and threads in the process list
|
|
ldavg-1
|
System load average for the last minute
|
|
ldavg-5
|
System load average for the past 5 minutes
|
|
ldavg-15
|
System load average for the past 15 minutes
|
Store the sar output to a file
[root@test1 ~]# sar -u 1 3 -o test.txt
Linux 2.6.18-194.26.1.el5 (test1) 02/20/14
05:50:26 CPU %user %nice %system %iowait %steal %idle
05:50:27 all 0.00 0.00 0.06 0.12 0.00 99.81
05:50:28 all 0.00 0.00 0.06 0.12 0.00 99.81
05:50:29 all 0.00 0.00 0.06 0.56 0.00 99.38
Average: all 0.00 0.00 0.06 0.27 0.00 99.67 Explanation: You can save the readings to a file in binary form which can be viewed again using sar -f parameter
Collect report from a file (created above)
[root@test1 ~]# sar -f test.txt
Linux 2.6.18-194.26.1.el5 (test1) 02/20/14
05:50:26 CPU %user %nice %system %iowait %steal %idle
05:50:27 all 0.00 0.00 0.06 0.12 0.00 99.81
05:50:28 all 0.00 0.00 0.06 0.12 0.00 99.81
05:50:29 all 0.00 0.00 0.06 0.56 0.00 99.38
Average: all 0.00 0.00 0.06 0.27 0.00 99.67
Collect sar reports from file for specific date
By default all the sar reports are stored inside /var/lg/sa/saXX as binary file. To read those files use the below command with show arguments
[deepak@test1 ~]$ sar -f /var/log/sa/sa19 -q
Linux 2.6.18-348.el5 (test1) 02/19/14
00:00:01 runq-sz plist-sz ldavg-1 ldavg-5 ldavg-15
00:10:01 14 3319 14.28 16.29 15.79
00:20:01 9 3230 18.34 17.97 16.63
00:30:01 15 3174 11.57 11.52 13.80
00:40:01 7 2949 12.50 12.58 13.07
23:30:01 6 2499 10.09 11.53 12.10
23:40:02 7 2591 19.20 16.10 13.74
23:50:01 19 3515 29.81 22.92 18.09
Average: 7 2510 9.79 9.72 9.66 Explanation: Using the above command you are collecting report for load average (-q) for 19th day(sa19) of the current month. I have skimmed the output here. Now since I have not used any other time related argument it will show me the load average output for the complete day.
Collect sar reports from file for specific date and specific time
[deepak@test1 ~]$ sar -f /var/log/sa/sa19 -q -s 19:00:00 -e 20:00:00
Linux 2.6.18-348.el5 (test1) 02/19/14
19:00:01 runq-sz plist-sz ldavg-1 ldavg-5 ldavg-15
19:10:01 1 2286 2.36 1.81 1.59
19:20:01 0 2284 0.48 1.32 1.55
19:30:01 2 2286 0.39 0.48 0.97
19:40:01 1 2290 2.72 2.13 1.54
19:50:01 0 2288 2.13 2.58 2.08
Average: 1 2287 1.62 1.66 1.55 Explanation: Using the above command I have given a time argument with start(-s) and end(-e) time to get the reports only for that particular time interval
Collect Monthly reports
By default you can view reports for only the current month or as it is set inside /etc/sysconfig/sysstat
To view the default settings
[deepak@test1 ~]$ cat /etc/sysconfig/sysstat
# How long to keep log files (days), maximum is a month
HISTORY=7
So as you see the maximum time you can keep your report is for 1 month but still if you want to save reports for more than a month follow the below steps.
[root@test1 201404]# cat /etc/sysconfig/sysstat
# sysstat-9.0.4 configuration file.
# How long to keep log files (in days).
# If value is greater than 28, then log files are kept in
# multiple directories, one for each month.
HISTORY=30
# cd /var/log/sa/
[root@test1 sa]# ls -l
total 8
drwxr-xr-x 2 root root 4096 Apr 2 10:10 201403
drwxr-xr-x 2 root root 4096 Apr 2 10:10 201404
lrwxrwxrwx 1 root root 11 Apr 2 10:10 sa02 -> 201404/sa02
lrwxrwxrwx 1 root root 12 Apr 2 10:10 sar02 -> 201404/sar02
Collect Graphical reports using ksar
If you do not feel comfortable using CLI interface then there is an alternate option to use Graphical interface for all the reports.
For this purpose you will have to download kar package which can be done using the belw link
KSAR download
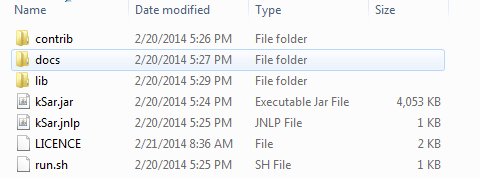
Once the package is downloaded. Extract it at any preferred location.
Move into the ksar directory created after extraction step, you should see the below directories/file.
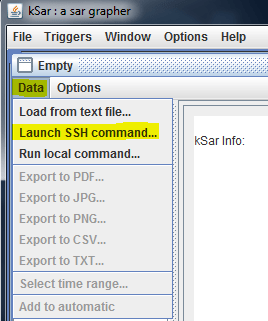
Double click "Ksar.jar" java file. After which the below windows should come up.
Click on Data and select "Launch SSH Command.."
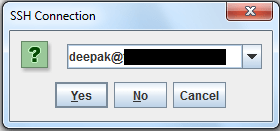
In the next pop up window provide the host name you want to connect using the below mentioned syntax
username@server-name
For exampledeepak@192.168.0.5
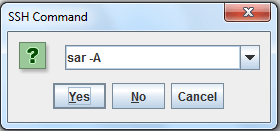
Use the shown command as it will give you the complete graphical report for the whole day
Once the data import is finished you will see the below popup window. Click OK
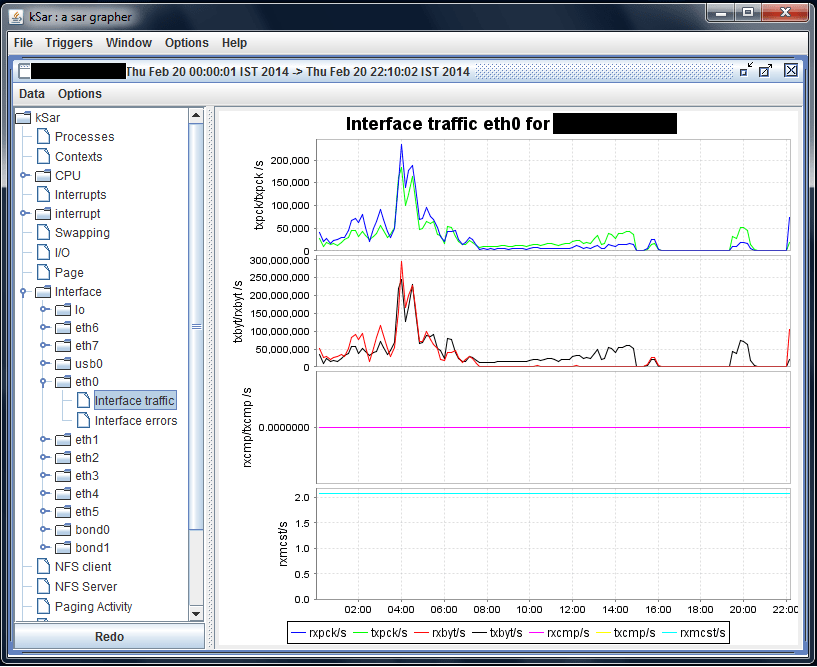
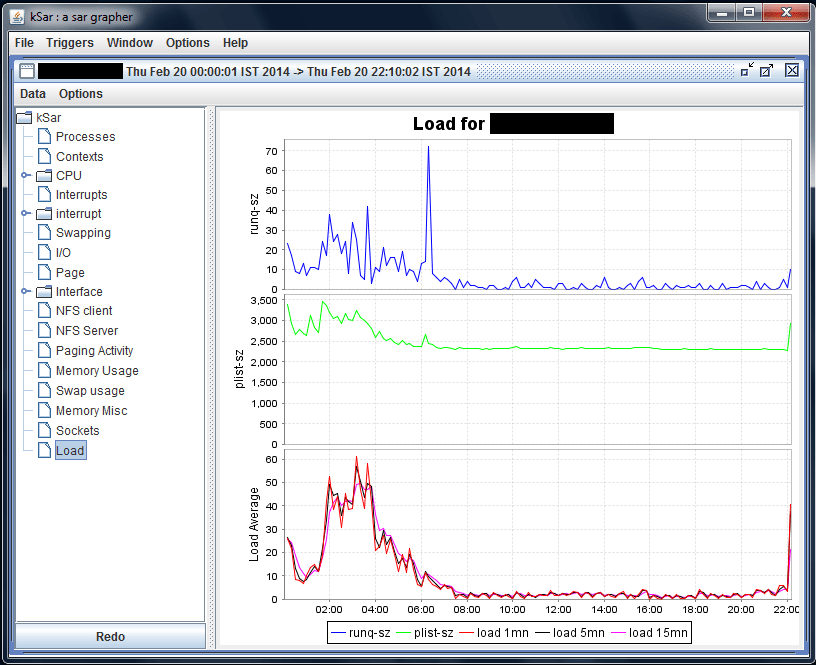
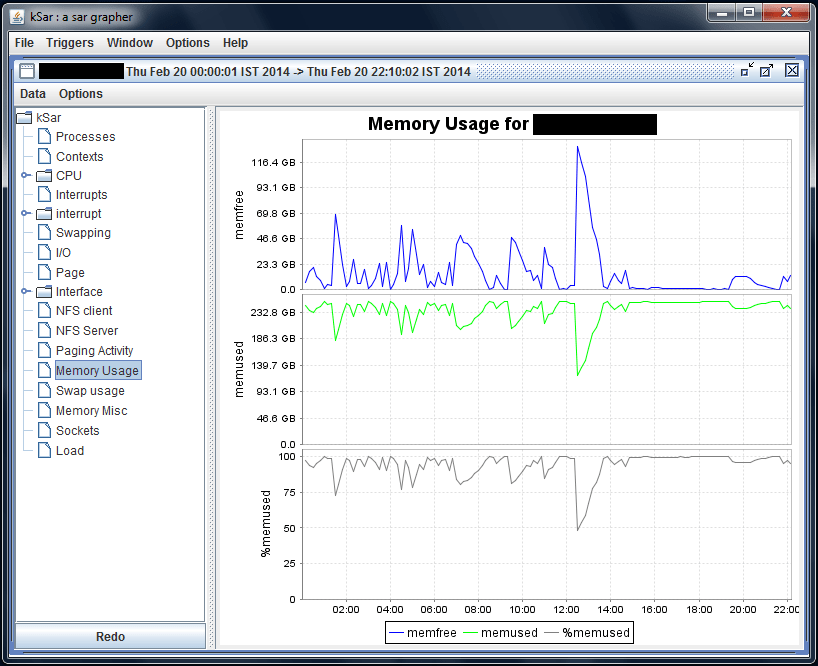
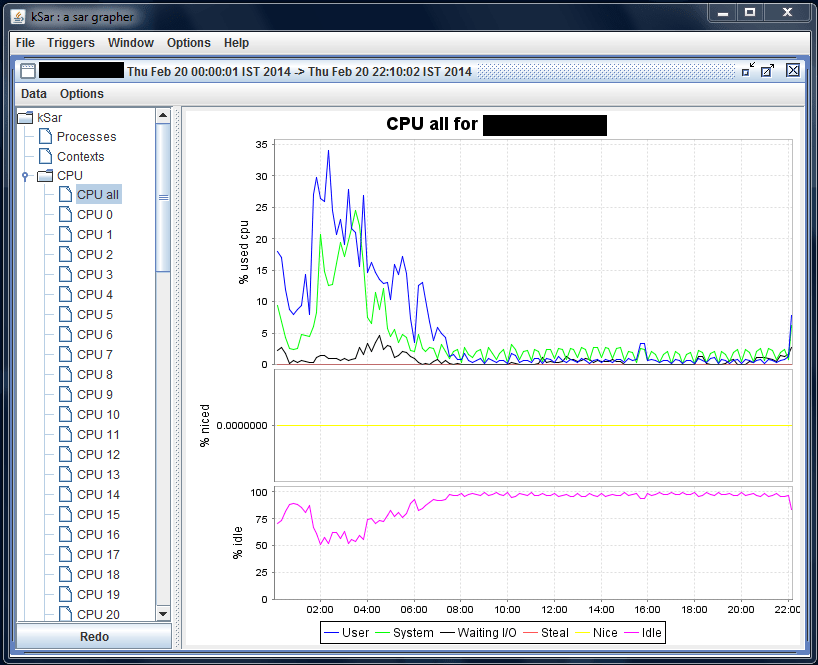
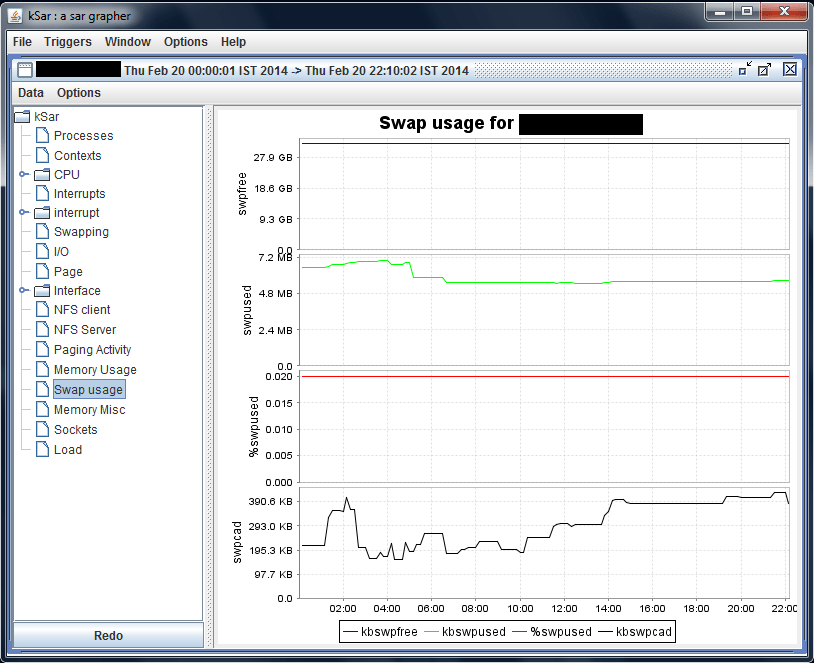
Now you can select different parameters as shown in the left panel of the ksar to view all the reports. I have shown few examples using few screenshots
Interface traffic for eth0
Load average Statistics
Memory usage Statistics
CPU usage Statistics
Swap Memory usage statistics
References:

