Below are the list of topics covered in this article:
What is kdump?
Kdump is a kernel crash dumping mechanism that allows you to save the contents of the system's memory for later analysis. It relies on kexec, which can be used to boot a Linux kernel from the context of another kernel, bypass BIOS, and preserve the contents of the first kernel's memory that would otherwise be lost.
In case of a system crash, kdump uses kexec to boot into a second kernel (a capture kernel). This second kernel resides in a reserved part of the system memory that is inaccessible to the first kernel. The second kernel then captures the contents of the crashed kernel's memory (a crash dump) and saves it.
Memory Requirements for KDUMP
In order for kdump to be able to capture a kernel crash dump and save it for further analysis, a part of the system memory has to be permanently reserved for the capture kernel. On some systems, it is possible to allocate memory for kdump automatically, either by using the crashkernel=auto parameter in the bootloader's configuration file, or by enabling this option in the graphical configuration utility.
The amount of reserved memory is either determined by the user or is used, it defaults to 128 MB plus 64 MB for each TB of physical memory (that is, a total of 192 MB for a system with 1 TB of physical memory).
|
Architecture
|
Required Memory
|
|
AMD64 and Intel 64 (x86_64)
|
2 GB
|
|
IBM POWER (ppc64)
|
2 GB
|
|
IBM System z (s390x)
|
4 GB
|
In order use the kdump service on your system, make sure you have the kexec-tools package installed. To do so, type the following at a shell prompt as root:
# yum install kexec-toolsYou can configure the same using GUI console but for that make sure the below package is installed
# yum install system-config-kdump
Configure kdump
Run the below command from your GUI console
NOTE: Make sure you are in runlevel 5 before running the below command or else it will throw out an error.
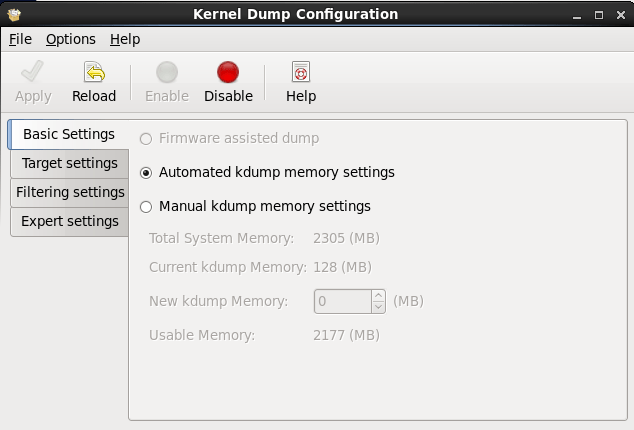
# system-config-kdumpOnce you run it a GUI console as shown below will come up
The Basic Settings Tab
The Basic Settings tab enables you to configure the amount of memory that is reserved for the kdump kernel. To do so, select the Manual kdump memory settings radio button, and click the up and down arrow buttons next to the New kdump Memory field to increase or decrease the value. Notice that the Usable Memory field changes accordingly showing you the remaining memory that will be available to the system.
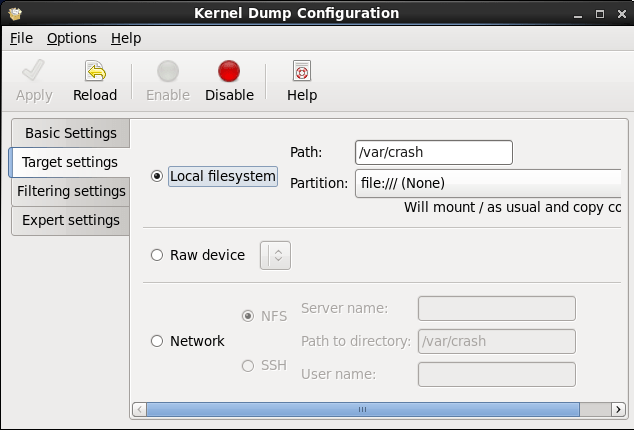
The Target Settings Tab
The Target Settings tab enables you to specify the target location for the vmcore dump. It can be either stored as a file in a local file system, written directly to a device, or sent over a network using the NFS (Network File System) or SSH (Secure Shell) protocol.
# /usr/sbin/makedumpfile -R "/tmp/vmcore-`date`" < "vmcore.flat"The Filtering Settings Tab
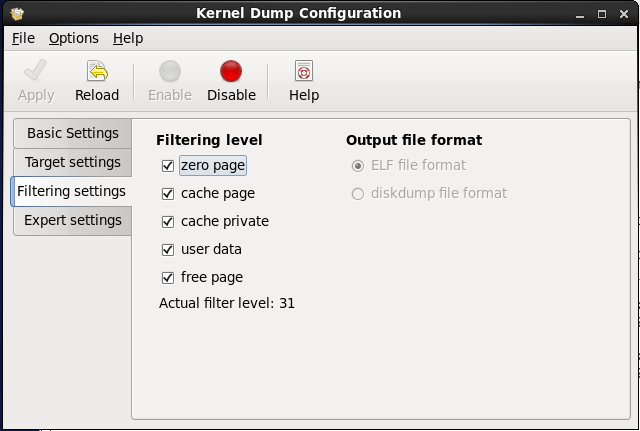
The Filtering Settings tab enables you to select the filtering level for the vmcore dump.
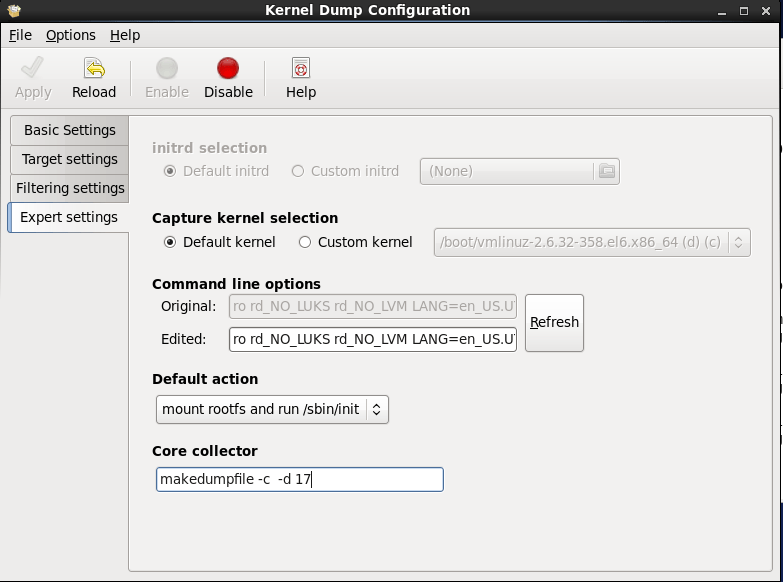
The Expert Settings Tab
To enable the dump file compression, add the -c parameter.
core_collector makedumpfile -cTo remove certain pages from the dump, add the -d value parameter, where value is a sum of values of pages you want to omit as described in the below table
For example, to remove both zero and free pages, use the following:
core_collector makedumpfile -d 17 -c|
Option
|
Description
|
|
1
|
Zero Pages
|
|
2
|
Cache Pages
|
|
4
|
Cache Private
|
|
8
|
User Pages
|
|
16
|
Free Pages
|
Once done save and exit the console. Next make sure the kdump service has been started and its enabled to start at every reboot
[root@localhost ~]# /etc/init.d/kdump status
Kdump is operational
[root@localhost ~]# chkconfig kdump --list
kdump           0:off   1:off   2:off   3:on    4:on    5:on    6:off
Configure kdump using CLI
# less /etc/kdump.conf
#raw /dev/sda5
#ext4 /dev/sda3
#ext4 LABEL=/boot
#ext4 UUID=03138356-5e61-4ab3-b58e-27507ac41937
#net my.server.com:/export/tmp
#net user@my.server.com
#core_collector scp
#core_collector cp --sparse=always
#extra_bins /bin/cp
#link_delay 60
#kdump_post /var/crash/scripts/kdump-post.sh
#extra_bins /usr/bin/lftp
#disk_timeout 30
#extra_modules gfs2
#options modulename options
#default shell
#debug_mem_level 0
#force_rebuild 1
#sshkey /root/.ssh/kdump_id_rsa
path /var/crash
core_collector makedumpfile -c -d 17
Sample grub.conf file
# less /etc/grub.conf
default=0
timeout=5
splashimage=(hd0,0)/grub/splash.xpm.gz
hiddenmenu
title CentOS (2.6.32-358.el6.x86_64)
root (hd0,0)
kernel /vmlinuz-2.6.32-358.el6.x86_64 root=UUID=c7c70914-09c8-475a-b990-07eb728fcbd5 ro rd_NO_LUKS rd_NO_LVM LANG=en_US.UTF-8 rd_NO_MD SYSFONT=latarcyrheb-sun16 crashkernel=auto KEYBOARDTYPE=pc KEYTABLE=us rd_NO_DM rhgb quiet
initrd /initramfs-2.6.32-358.el6.x86_64.img
Analyzing the kdump
To create a test scenario we can manually crash the kernel using the below command
echo 1 > /proc/sys/kernel/sysrq
echo c > /proc/sysrq-trigger
This will force the Linux kernel to crash, and the address-YYYY-MM-DD-HH:MM:SS/vmcore file will be copied to the location you have selected in the configuration (that is, to /var/crash/ by default).
To analyze the vmcore dump file, you must have the crash and kernel-debuginfo packages installed.
# yum install crashTo install the kernel-debuginfo package, make sure that you have the yum-utils package installed and run the following command as root:
# debuginfo-install kernel
NOTE: To install kernel-debug you need to have access to the repository with all the debug rpms. For Red Hat you need a proper subscription for the same and for CentOS you need to enable the repository inside /etc/yum.repos.d/CentOS-Debuginfo.repo
[debug]
name=CentOS-6 - Debuginfo
baseurl=http://debuginfo.centos.org/6/$basearch/
gpgcheck=1
gpgkey=file:///etc/pki/rpm-gpg/RPM-GPG-KEY-CentOS-Debug-6
enabled=1
Turn enable 0 to 1 in the above file
Running the crash utility
[root@localhost ~]# crash /usr/lib/debug/lib/modules/2.6.32-358.el6.x86_64/vmlinux /var/crash/127.0.0.1-2015-02-08-07:55:25/vmcorecrash 6.1.0-5.el6
Copyright (C) 2002-2012 Red Hat, Inc.
Copyright (C) 2004, 2005, 2006, 2010 IBM Corporation
Copyright (C) 1999-2006 Hewlett-Packard Co
Copyright (C) 2005, 2006, 2011, 2012 Fujitsu Limited
Copyright (C) 2006, 2007 VA Linux Systems Japan K.K.
Copyright (C) 2005, 2011 NEC Corporation
Copyright (C) 1999, 2002, 2007 Silicon Graphics, Inc.
Copyright (C) 1999, 2000, 2001, 2002 Mission Critical Linux, Inc.
This program is free software, covered by the GNU General Public License,
and you are welcome to change it and/or distribute copies of it under
certain conditions. Enter "help copying" to see the conditions.
This program has absolutely no warranty. Enter "help warranty" for details.
GNU gdb (GDB) 7.3.1
Copyright (C) 2011 Free Software Foundation, Inc.
License GPLv3+: GNU GPL version 3 or later <http://gnu.org/licenses/gpl.html>
This is free software: you are free to change and redistribute it.
There is NO WARRANTY, to the extent permitted by law. Type "show copying"
and "show warranty" for details.
This GDB was configured as "x86_64-unknown-linux-gnu"...
KERNEL: /usr/lib/debug/lib/modules/2.6.32-358.el6.x86_64/vmlinux
DUMPFILE: /var/crash/127.0.0.1-2015-02-08-07:55:25/vmcore [PARTIAL DUMP]
CPUS: 1
DATE: Sun Feb 8 02:25:21 2015
UPTIME: 00:12:43
LOAD AVERAGE: 0.00, 0.01, 0.01
TASKS: 183
NODENAME: localhost.localdomain
RELEASE: 2.6.32-358.el6.x86_64
VERSION: #1 SMP Fri Feb 22 00:31:26 UTC 2013
MACHINE: x86_64 (2594 Mhz)
MEMORY: 2 GB
PANIC: "Oops: 0002 [#1] SMP " (check log for details)
PID: 2482
COMMAND: "bash"
TASK: ffff8800377a7500 [THREAD_INFO: ffff88007ae3c000]
CPU: 0
STATE: TASK_RUNNING (PANIC)Displaying the Message Buffer
To display the kernel message buffer, type the log command at the interactive prompt.
crash> log
Initializing cgroup subsys cpuset
Initializing cgroup subsys cpu
Linux version 2.6.32-358.el6.x86_64 (mockbuild@c6b8.bsys.dev.centos.org) (gcc version 4.4.7 20120313 (Red Hat 4.4.7-3) (GCC) ) #1 SMP Fri Feb 22 00:31:26 UTC 2013
Command line: ro root=UUID=c7c70914-09c8-475a-b990-07eb728fcbd5 rd_NO_LUKS rd_NO_LVM LANG=en_US.UTF-8 rd_NO_MD SYSFONT=latarcyrheb-sun16 crashkernel=auto  KEYBOARDTYPE=pc KEYTABLE=us rd_NO_DM rhgb quiet
KERNEL supported cpus:
Intel GenuineIntel
AMD AuthenticAMD
Centaur CentaurHauls
Disabled fast string operations
BIOS-provided physical RAM map:
BIOS-e820: 0000000000000000 - 000000000009f000 (usable)
BIOS-e820: 000000000009f000 - 00000000000a0000 (reserved)
BIOS-e820: 00000000000ca000 - 00000000000cc000 (reserved)
BIOS-e820: 00000000000dc000 - 0000000000100000 (reserved)
BIOS-e820: 0000000000100000 - 000000007fee0000 (usable)
BIOS-e820: 000000007fee0000 - 000000007feff000 (ACPI data)
BIOS-e820: 000000007feff000 - 000000007ff00000 (ACPI NVS)
BIOS-e820: 000000007ff00000 - 0000000080000000 (usable)
Displaying a Backtrace
To display the kernel stack trace, type the bt command at the interactive prompt. You can use bt pid to display the backtrace of the selected process.
crash> bt
PID: 2482   TASK: ffff8800377a7500  CPU: 0   COMMAND: "bash"
#0 [ffff88007ae3d9e0] machine_kexec at ffffffff81035b7b
#1 [ffff88007ae3da40] crash_kexec at ffffffff810c0db2
#2 [ffff88007ae3db10] oops_end at ffffffff815111d0
#3 [ffff88007ae3db40] no_context at ffffffff81046bfb
#4 [ffff88007ae3db90] __bad_area_nosemaphore at ffffffff81046e85
#5 [ffff88007ae3dbe0] bad_area at ffffffff81046fae
#6 [ffff88007ae3dc10] __do_page_fault at ffffffff81047760
#7 [ffff88007ae3dd30] do_page_fault at ffffffff8151311e
#8 [ffff88007ae3dd60] page_fault at ffffffff815104d5
[exception RIP: sysrq_handle_crash+22]
RIP: ffffffff8133d626  RSP: ffff88007ae3de18  RFLAGS: 00010096
RAX: 0000000000000010  RBX: 0000000000000063  RCX: 0000000000000000
RDX: 0000000000000000  RSI: 0000000000000000  RDI: 0000000000000063
RBP: ffff88007ae3de18   R8: 0000000000000000   R9: 203a207152737953
R10: 0000000000000000  R11: 0000000000000000  R12: 0000000000000000
R13: ffffffff81affea0  R14: 0000000000000286  R15: 0000000000000004
ORIG_RAX: ffffffffffffffff  CS: 0010  SS: 0018
#9 [ffff88007ae3de20] __handle_sysrq at ffffffff8133d8e2
#10 [ffff88007ae3de70] write_sysrq_trigger at ffffffff8133d99e
#11 [ffff88007ae3dea0] proc_reg_write at ffffffff811e95ae
#12 [ffff88007ae3def0] vfs_write at ffffffff81180f98
Now these crash dump mostly contains hexa decimal values which you can send to your OS support team as they can guide you further if case it is related to hardware/kernel issues.


